Showing posts with label original research. Show all posts

Tuesday, March 08, 2022

Independent evaluation of AlphaFold-Multimer

AlphaFold2 has been widely reported as a fantastic leap forward in the prediction of protein structures from sequence, when sequence has enough homologs to build a reasonable multiple sequence alignment.  When AlphaFold2 was released (Jumper et al. 2021) there were several independent reports of how it could also be used for the prediction of structures of protein complexes despite the fact that it was not trained to do so (Bryant et al., 2021; Ko and Lee, 2021; Mirdita et al. 2022). Together with the lab of Arne Elofsson, in work led by David Burke in our group and Patrick Bryant in Arne's group, we have shown that it can be applied in reasonably large scale to predict structures of protein complexes for known human interactions (Burke et al. 2021). There is a lot to investigate still but it is clear that this is an extremely exciting direction of research since that lead to a major advances in the structural analysis of cell biology, evolution, biotechnology, etc. 

Soon after these first reports, DeepMind released an AlphaFold version that was re-trained specifically for prediction of structures of protein complex - AlphaFold-Multimer (Evans et al. 2021). Given that they reported an even higher success rate with this specifically trained model we were quite excited to give this a try. David Burke selected a set of 650 pairs of human proteins from the Hu.MAP dataset, known to physically interact and for which the experimental structure has been solved. A structure was predicted using AF v2.1.1 (AF-multimer) using default settings and the model_1_multimer parameter set. A second model was predicted using AF using the model1 monomer parameter set and the FoldDock pipeline. For each model, DockQ scores were produced which reflect the similarity of the predicted structure with the experimental structure with a specific focus on the interaction interface residues. A DockQ score value below 0.23 can be considered essentially an incorrect or random model. 

Below we show a direct comparison between the two AlphaFold2 models with the AF2 Multimer showing a very significant improvement based on DockQ scores. Of all predictions tested, there were 51% above DockQ>0.23 with AF2 Multimer and 40%>0.23 with "standard" AlphaFold2. This improvement (+11%) is not as large as that reported by the DeepMind team (+25%) on their own test set. There could be several reasons for the difference but more importantly this would be more than enough to justify using Multimer for the prediction of protein complexes. 


However, David quickly realised that there were many examples of clashes at the predicted interface with the AF2 Multimer model. In the figure below we show just an example of this which, despite the high DockQ score (0.85) clearly has several overlapping residues. That is, while the interface region is likely to be correct, the model at the interface has serious errors. 


These clashes in predicted structures are quite frequent with 69% of predictions having some clash. The clashes can be quite extreme with several involving a very high fraction of the total length of the protein as shown in the distribution below. Such clashes are essentially not seen in the predictions made with the earlier version of AlphaFold2. 

While there may be some cases where the clashes could be minimised, as it stands the models produced by AF-multimer may not be usable for a large fraction of cases. However, these issues are of course easy to spot. DeepMind is in fact aware of this bug since around November and have said they are working on it. From the point of view of predicting the regions of the proteins where the interaction will occur AF-multimer may still be usable as it is and hopefully DeepMind will find a fix for this problem. 


Friday, February 10, 2017

Predicting E3 or protease targets with paired protein & gene expression data (negative result)

Cancer datasets as a resource to study cell biology

The amazing resources that have been developed in the context of cancer biology can serve as tools to study "normal" cell biology. The genetic perturbations that happen in cancer can be viewed almost as natural experiments that we can use to ask varied questions. Different cancer consortia have produced, for the same patient samples or the same cancer cell lines, data that ranges from genomic information, such as exome sequencing, to molecular, cellular and disease traits including gene expression, protein abundance, patient survival and drug responses. These datasets are not just useful to study cancer biology but more globally to study cell biology processes. If we were interested in asking what is the impact of knocking out a gene we could look into these data to have, at least, an approximate guess of what could happen if this gene is perturbed. We can do this because it is likely that almost any given gene will have changes in copy number or deleterious mutations given a sufficiently large sample of tumours or cell lines. Of course, there will be a whole range of technical issues to deal with since it would not be a "clean" experiment comparing the KO with a control.

Studying complex assembly using protein abundance data

More recently the CPTAC consortium and other groups have released proteomics measurements for some of the reference cancer samples. Given the work that we have been doing in studying post-translational control we started a few projects making use of these data. One idea that we tried and have recently made available online via a pre-print was to study gene dosage compensation. When there are copy number changes, how often are these propagated to changes in gene expression and then to protein level ? This was work done by Emanuel Gonçalves (@emanuelvgo), jointly with Julio Saez-Rodriguez lab.  There were several interesting findings from this project, one of these was that we could identify members of protein complexes that indirectly control the degradation of other complex subunits. This was done by measuring, in each sample, how much of the protein abundance changes are not explained by its gene expression changes. This residual abundance change is most likely explained either by changes in the translation or degradation rate of the protein (or noise). We think that, for protein complex subunits, this residual mainly reflects degradation rates. Emanuel then searched for complex members that had copy number changes that predicted the "degradation" rate of other subunits of the same complex. We think this is a very robust way to identify such subunits that act as rate-limiting factors for complex assembly.

Predicting E3 or protease targets

If what I described above works to find some subunits that control the "degradation" of other subunits of a complex then why not use the exact same approach to find the targets of E3 ligases or proteases ? Emanuel gave this idea a try but in some (fairly quick) tests we could not see a strong predictive signal. We collected putative E3 targets from a few studies in the literature (Kim  et al. Mol Cell Biol. 2015; Burande et al, Mol Cell Proteomics. 2009; Lee et al. J Biol Chem. 2011; Coyaud et al. Mol Cell Proteomics. 2015Emanuele MJ et al. Cell 2011). We also we collected protease targets from the Merops database. We then tried to find a significant association between the copy number or gene expression changes of a given E3 with the proxy for degradation, as described above, of any other protein. Using the significance of the association as the predictor with would expect a stronger association between an E3 and their putative substrates than with other random genes. Using a ROC curve as descriptor of the predictive power, we didn't really see robust signals. The figure above shows the results when using gene expression changes in the E3 to associate with the residuals (i.e. abundance change not explained by gene expression change) of the putative targets. The best result, was obtained for CUL4A (AUC=0.59) in this case but overall the predictions are close to random.


A similar poor result was generally observed for protease targets from the merops database although we didn't really make a strong effort to properly map the merops interactions to all human proteins. Emanuel tried a couple of variations. For the E3s he tried restricting the potential target list to proteins that are known to be ubiquitylated in human cells but that did not improve the results. Also, surprisingly, the genes listed as putative targets of these E3s are not very enriched in genes that increase in ubiquitylation after proteasome inhibition (from Kim et al. Mol Cell. 2011) with the clearest signal observed in the E3 targets proposed by Emanuele MJ and colleagues (Emanuele MJ et al. Cell 2011).


Why doesn't it work ? 

There are many reasons for the lack of capacity to predict E3/protease targets in this way. The residuals that we calculate across samples may reflect a mixture of effects and degradation may be only a small component. The regulation of degradation is complex and, as we have shown for the complex members, it may be dependent on other factors besides the availability of the E3s/proteases. It is possible that the E3s/proteases are highly regulated and/or redundant such that we would not expect to see a simple relationship between changing the expression of one E3/protease and the abundance level of the putative substrate. The list of E3/protease targets may contain false positives and of course, we may have not found the best way to find such associations in these data. In any case, we though it could be useful to provide this information in some format for others that may be trying similar things.  

Wednesday, March 28, 2012

Individual genomics of yeast

Nature Genetics used to be one of my favorite science journals. It consistently had papers that I found exciting. That changed about 5 years ago or so when they had a very clear editorial shift into genome-wide association studies (GWAS). Don't take me wrong, I think GWAS are important and useful but I don't find it very exciting to have lists of regions of DNA that might be associated with a phenotype. I want to understand how variation at the level of DNA gets propagated through structures and interaction networks to cause these differences in phenotype. I mostly stayed out of GWAS since I was focusing on the evolution of post-translational networks using proteomics data but I always felt that this line research was not making full use of what we know already about how a cell works.

In this context, I want to tell you about a paper that came out from Ben Lehner's lab that finally made me excited about individual variation and why I think it is such a great study. I was playing around with the similar idea when the paper came out so I will start with the (very) preliminary work I did and continue with their paper. I hope it can serve as small validation of their approach.

As I just mentioned, I think we can make use of what we know about cell biology to interpret the consequence of genetic variation. Instead of using association studies to map DNA regions that might be linked to a phenotype, we can take a full genome and try to guess what could be deleterious changes and their consequences. It is clear that full genome sequences for individuals are going to be the norm so how do we start to interpret the genetic variations that we see ? For human genetic variation, this is a highly complex and challenging task.

Understanding the consequences of human genetic variation from the DNA to phenotype requires knowledge of how variation will impact on proteins's stability, expression and kinetics; how this in turn changes interaction networks; how this variation is reflected in each tissue function; and ultimately to a fitness difference, disease phenotype or response to drugs. Ultimately we would like to be able to do this but we can start with something simpler. We can take unicellular species (like yeast) and start by understanding cellular phenotypes before we move to more complex species.

To start we need full genome sequences for many different individuals of the same species. For S. cerevisiae we have genome sequences for 38 different isolates by Liti et al. We then need phenotypic differences across these different individuals. For S. cerevisiae there was a great study published June last year by Warringer and colleagues were they tested the growth rate of these isolates under ~200 conditions.  Having these data together we can attempt to predict how the observed mutations might result in the differences in growth. As a first attempt we can look at the non-synonymous coding mutations. For these 38 isolates there are something like 350 thousand non-synonymous coding mutations. We can predict the impact of these mutations on a protein either by analyzing sequence alignments or using structures and statistical potentials. There are advantages and disadvantages to both of the approaches but I think they end up being complementary. The sequence analysis required large alignments while the structural methods require a decent structural model of the protein. I think we will need a mix of both to achieve a good coverage of the proteome.

I started with the sequence approach as it was faster. I aligned 2329 S. cerevisiae proteins with more than 15 orthologs in other fungal species and used MAPP from the Sidow lab at Stanford to calculate how constrained each position is. I got about 50K non-synonymous mutations scored with MAPP of which about 1 to 8 thousand could be called potentially deleterious depending on the cut-off. To these we can add mutations that introduce STOP codons, in particular if they occur early in the protein (~710 of these within the first 50 AAs of proteins).

So up to here we have a way to predict if a mutation is likely to impact negatively on a protein's function and/or stability. How do we go from here to a phenotype like a decrease growth rate under the presence of stress X ? This is exactly the question that chemical-genetic studies try to address. Many labs, including our own,  have used knock-out collections (of lab strains) to measure chemical-genetic interactions that give you a quantitative relative importance of each protein in a given condition. So, we can make the *huge* simplification that we can take all deleterious mutations and just sum up the effects assuming a linear combination of the effects of the knock-outs.

To test this idea I picked 4 conditions (out of the 200 from mentioned above) for which we have chemical-genetic information (from Parsons et al. ) and where there is a high growth rate variation across the 38 strains. With everything together I can test how well we can predict the the measured growth rates under these conditions (relative to a lab strain):
Each entry in the plot represents 1 strain in a given condition. Higher values report worse predicted/experimental growth (relative to a lab strain). There is a highly significant correlation between measured and predicted growth defects (~0.57) overall but cisplain growth differences are not well predicted by these data. Given the many simplifications and poor coverage of some of the methods used I was even surprised to see the correlation at all. This tells us, that at least for some conditions, we can use mutations found in coding regions and appropriately selected gene sets to predict growth differences.

This is exactly the message of the Rob Jelier's paper from Ben Lehner's lab. When they started their work, the phenotypic dataset from Warringer and colleagues was not yet published so they had to generate their own measurements for this study. In addition their study is much more careful in several different ways. For example they only used the sequences for 19 strains that they say have higher coverage and accuracy. They also tried to estimate the impact of indels and they try to increase the size of the alignments (a crucial step in this process) by searching for distant homologs. If you are interested in making use of "personal" genomes you should really read this paper.

Stepping back a bit I think I was excited about this paper because it finally connects the work that has been done in high-throughput characterization of a model organism with the diversity across individuals of that species. It serves as bridge for many people to come to work in this area. There are a large number of immediate questions like how much do we really need to know to make good/better predictions ? What kind of interactions (transcriptional, genetic, conditional genetic) do we need to know to capture most of the variation ? Can we select gene-set and gene weights in other species without the conditional-genetics information (by homogy) ?

As we are constantly told, the deluge of genome sequences will continue so there are plenty of opportunities and data to analyze (I wish I had more time ;). Some recent examples of interest include the sequencing of 162 D. melanogaster lines with associated phenotypic data and the (somewhat narcissistic) personal 'omics study of Michael Snyder. To start to make the jump to human I think it would be great to have cellular phenotypic data (growth rate/survival under different conditions) for the same cells/tissue across a number of human individuals with a sequenced genome. Maybe in a couple of years I wont be as skeptical as I am now about our fortune cookie genomes.


Tuesday, August 11, 2009

Translationally optimal codons do not appear to significantly associate with phosphorylation sites

I recently read an interesting paper about codon bias at structurally important sites that sent me on a small detour from my usual activities. Tong Zhou, Mason Weems and Claus Wilke, described how translationally optimal codons are associated with structurally important sites in proteins, such as the protein core (Zhou et al. MBE 2009). This work is a continuation of the work from this same lab on what constraints protein evolution. I have written here before a short review of the literature on the subject. As a reminder, it was observed that the expression level is the strongest constraint on a protein's rate of change with highly expressed genes coding for proteins that diverge slower than lowly expressed ones (Drummond et al. MBE 2006). It is currently believed that selection against translation errors is the main driving force restricting this rate of change (Drummond et al. PNAS 2005,Drummond et al. Cell 2008). It has been previously shown that translation rates are introduced, on average, at an order of about 1 to 5 per 10000 codons and that different codons can differ in their error rates by 4 to 9 fold, influenced by translational properties like the availability of their tRNAs (Kramer et al. RNA 2007).

Given this background of information what Zhou and colleagues set out to do, was test if codons that are associated with highly expressed genes tend to be over-represented at structurally important sites. The idea being that such codons, defined as "optimal codons" are less error prone and therefore should be avoided at positions that, when miss-translated, could destabilize proteins. In this work they defined a measure of codon optimality as the odds ratio of codon usage between highly and lowly expressed genes. Without going into many details they showed, in different ways and for different species, that indeed, codon optimality is correlated with the odds of being at a structurally important site.

I decided to test if I could also see a significant association between codon optimality and sites of post-translational modifications. I defined a window of plus or minus 2 amino-acids surrounding a phosphorylation site (of S. cerevisiae) as associated with post-translational modification. The rationale would be that selection for translational robustness could constraint codon usage near a phosphorylation site when compared with other Serine or Threonine sites. For simplification I mostly ignored tyrosine phosphorylation that in S. cerevisiae is a very small fraction of the total phosphorylation observed to date .
For each codon I calculated its over representation at these phosphorylation windows compared to similar windows around all other S/T sites and plotted this value against the log of the codon optimality score calculated by Zhou and colleagues.
Figure 1 - Over-representation of optimal codons at phosphosites
At first impression it would appear that there is a significant correlation between codon optimality and phosphorylation sites. However, as I will try to describe below this is mostly due to differences in gene expression. Given the relatively small number of phosphorylation sites per protein, it is hard to test this association for each protein independently as it was done by Zhou and colleagues for the structurally important sites. The alternative is therefore to try to take into account the differences in gene expression. I first checked if phosphorylated proteins tend to be coded by highly expressed genes.
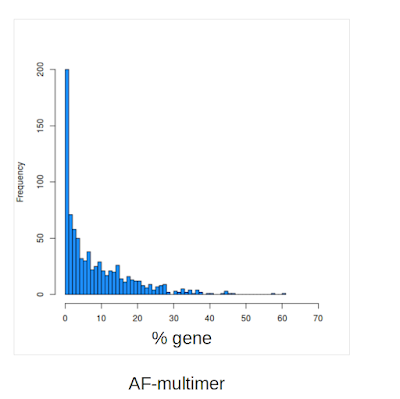
Figure 2 - Distribution of gene expression of phosphorylated proteins

I figure 2 I plot the distribution of gene expression for phosphorylated and non-phosphorylated proteins. There is only a very small difference observed with phosphoproteins having a marginally higher median gene expression when compared to other proteins. However this difference is small and a KS test does not rule out that they are drawn from the same distribution.

The next possible expression related explanation for the observed correlation would be that highly expressed genes tend to have more phosphorylation sites. Although there is no significant correlation between the gene expression level and the absolute number of phosphorylation sites, what I observed was that highly expressed proteins tend to be smaller in size. This means that there is a significant positive correlation between the fraction of phosphorylated Serine and Threonine sites and gene expression.
Figure 3 - Expression level correlates with fraction of phosphorylated ST sites

Unfortunately, I believe this correlation explains the result observed in figure 1. In order to properly control for this observation I calculated the correlation observed in figure 1 randomizing the phosphorylation sites within each phosphoprotein. To compare I also randomized the phosphorylation sites keeping the total number of phosphorylation sites fixed but not restricting the number of phosphorylation sites within each specific phosphoprotein.

Figure 4 - Distribution of R-squared for randomized phosphorylation sites

When randomizing the phosphorylation sites within each phosphoprotein, keeping the number of phosphorylation sites in each specific phosphoproteins constant the average R-squared is higher than the observed with the experimentally determined phosphorylation sites (pink curve). This would mean that the correlation observed in figure 1 is not due to functional constraints acting on the phosphorylation sites but instead is probably due to the correlation observed in figure 3 between the expression level and the fraction of phosphorylated S/T residues.
The observed correlation would appear to be significantly higher than random if we allow the random phosphorylation sites to be drawn from any phosphoprotein without constraining the number of phosphorylation sites in each specific protein (blue curve). I added this because I thought it was an striking example of how a relatively subtle change in assumptions can change the significance of a score.

I also tested if conserved phosphorylation sites tend to be coded by optimal codons when compared with non-conserved phosphorylation sites. For each phosphorylation site I summed over the codon optimality in a window around the site and compared the distribution of this sum for phosphorylation sites that are conserved in zero, one or more than one species. The conservation was defined based on an alignment window of +/- 10AAs of S. cerevisiae proteins against orthologs in C. albicans, S. pombe, D. melanogaster and H. sapiens.
Figure 5 - Distribution of codon optimality scores versus phospho-site conservation

I observe a higher sum of codon optimality for conserved phosphorylation sites (fig 5A) but this difference is not maintained if the codon optimality score of each peptide is normalized by the expression level of the source protein (fig 5B).

In summary, when the gene expression levels are taken into account, it does not appear to be an association between translationally optimal codons with the region around phosphorylation sites.  This is consistent with the weak functional constraints observed by in analysis performed by Landry and colleagues.

Wednesday, May 14, 2008

Prediction of phospho-proteins from sequence

I want to be able to predict what proteins in a proteome are more likely to be regulated by phosphorylation and hopefully use mostly sequence information. This post is a quick note to show what I have tried and maybe get some feedback from people that might have tried this before.

The most straightforward way to predict the phospho-proteins is to use existing phospho-site predictors in some way. I have used the GPS 2.0 predictor on the S. cerevisiea proteome with medium cutoff and including only Serine/Threonine kinases. The fraction of tyrosine phosphosites in S. cerevisiae is very low so I decided to for now not try to predict tyrosine phosphorylation.

This produces a ranked list of 4E6 putative phosphosites for the roughly 6000 proteins scored according to the predictor (each site is scored for multiple kinases). My question is how to best make use of these predictions if I mostly want to know what proteins are phosphorylated and not the exact sites. Using a set of known phosphorylated proteins in S. cerevisiae (mostly taken from expasy) I computed different final scores as a function of the of all phospho-site scores:
1) the sum
2) the highest value
3) the average
4) the sum of putative scores if they were above a threshold (4,6,10)
5) the sum of putative phosphosite scores if they were outside ordered protein segments as defined by a secondary structure predictor and above a score threshold

The results are summarized with the area under the ROC curve (known phosphoproteins were considered positives and all other negatives) :


In summary, the sum of all phospho-site scores is the best way that I found so far to predict what proteins are phospho-regulated. My interpretation is that phospho-regulated proteins tend to be multi-phosphorylated and/or regulated by multiple kinases so the maximum site score will not work as well as the sum. As a side note, although there are abundance biases in mass-spec data (the source of most of the phospho-data) protein abundance is a very poor predictor of phospho-regulation (AROC=0.55).

Disregarding putative sites outside predicted secondary structured protein segments did not improve the predictions as I would expect but I should try a few disorder predictors.

Ideas for improvements are welcomed, in particular sequence based methods. I would also like to avoid comparative genomics for now.

Wednesday, December 05, 2007

Open Science project on domain family expansion

Some domain families of similar function have expanded more than others during evolution. Different domain families might have significantly different constraints imposed by their fold that could explain these differences. This project aims to understand what properties determine these differences focusing in particular on peptide binding domains. Examples of constraints to explore include average cost of production or capacity to generate binding diversity for the domain family.

This project is also a test for using Google Code as a research project management system for open science (see here for project home). Wiki pages will be used to collect previous research and milestone discoveries during the project development and to write the final manuscript towards the end of the project. Issue tracking system can be used to organize the required project tasks and assign them to participants. The file repository can hold the datasets and code used to derive any result.


I plan to use the blog as a notebook for the project (tag: domainevolution) and the project home at Google Code as the repository and organization center. The next few post regarding the project will be dedicated to explain better why I am interested in the question and develop further what are some of my expectations. Anyone interested in contributing is more than welcome to join in along the way. I should say that I am not in any hurry and that this is something for my 20% time ;).

Saturday, November 10, 2007

Predicting functional association using mRNA localization

About a month ago Lécuyer and colleagues published a paper in Cell describing an extensive study of mRNA localization in Drosophila embryos during development. The main conclusion of this study was that a very large fraction (71%) of the genes they analyzed (2314) had localization patterns during some stage of the embryonic development. This includes both embryonic localization or sub-cellular localizations.

There is a lot of information that was gathered in this analysis and it should serve as resource for further studies. There is information for different developmental stages so it should also be possible to look for the dynamics of localization of the mRNAs. Another application of this data would be to use it as information source to predict functional association between genes.

Protein localization information as been used in the past for prediction of protein-protein interactions (both physical and genetic interactions). Typically this is done by integrating localization with other data sources in probabilistic analysis [Jansen R et al. 2003, Rhodes DR et al. 2005, Zhong W & Sternberg PW, 2006].

To test if mRNA localization could be used in the same way I took from this website the localization information gathered in the Cell paper and available genetic and protein interaction information for D.melanogaster genes/proteins (can be obtained for example in BioGRID among others). For this analysis I grouped physical and genetic interactions together to have a larger number of interactions to test. The underlying assumption is that both should imply some functional association of the gene pair.

The very first simple test is to have a look at all pairs of genes (with available localization information) and test how the likelihood that they interact depends on the number of cases where they were found to co-localized (see figure below). I discarded any gene for each no interaction was known.
As seen in the figure there is a significant correlation (r=0.63,N=21,p<0.01) between the likelihood of interaction and the number of co-localizations observed for the pair. At this point I did not exclude any localization term but since images were annotated using an hierarchical structure these terms are in some cases very broad.

More specific patterns should be more informative so I removed very broad terms by checking the fraction of genes annotated to each term. I created two groups of more narrow scope, one excluding all terms annotated to more than 50% of genes (denominated "localizations 50") and a second excluding all terms annotated to more than 30% of genes (localizations 30). In the figure below I binned gene pairs according to the number of co-localizations observed in the three groups of localization terms and for each bin calculated the fraction that interact.

As expected, more specific mRNA localization terms (localizations 30) are more informative for prediction of functional association since fewer terms are required to obtain the same or higher likelihood of interaction. The increased likelihood does not come at a cost of fewer pairs annotated. For example, there are similar number of gene pairs in bin "10-14" of the more specific localization terms (localizations 30) as in the bin ">20" for all localization terms (see figure below).
It is important to keep in mind that mRNA localization alone is a very poor predictor of genetic or physical interaction. I took the number of co-localization of each pair (using the terms in "localizations 30") and plotted a ROC curve to determine the area under the ROC curve (AROC or AUC). The AROC value calculated was 0.54, with a 95% confidence lower bound of 0.52 and a p value of 6E-7 of the true area being 0.5. So it is not random (that would be 0.5) but by itself is a very poor predictor.

In summary:
1) the degree of mRNA co-localization significantly correlates with the likelihood of genetic or physical association.
2) less ubiquitous mRNA localization patterns should be more informative for interaction prediction
3) the degree of mRNA co-localization is by itself a poor predictor of interaction but it should be possible to use this information to improve statistical methods to predict genetic/physical interactions.

This was a quick analysis, not thoroughly tested and just meant to confirm that mRNA localization should be useful for genetic/physical interaction predictions. I am not going to pursue this but if there is anyone interested I suggest that it could be interesting to see what terms have more predictive power with the idea of integrating this information with other data sources or also possibly directing future localization studies. Perhaps there is little point of tracking different developmental stages or maybe embryonic localization patterns are not as informative as sub-cellular localizations to predict functional association.


Jansen R, Yu H, Greenbaum D, Kluger Y, Krogan NJ, Chung S, Emili A, Snyder M, Greenblatt JF, Gerstein M. A Bayesian networks approach for predicting protein-protein interactions from genomic data. Science. 2003 Oct 17;302(5644):449-53.
Rhodes DR, Tomlins SA, Varambally S, Mahavisno V, Barrette T, Kalyana-Sundaram S, Ghosh D, Pandey A, Chinnaiyan AM. Probabilistic model of the human protein-protein interaction network.Nat Biotechnol. 2005 Aug;23(8):951-9.
Zhong W, Sternberg PW. Genome-wide prediction of C. elegans genetic interactions.Science. 2006 Mar 10;311(5766):1481-4.